What Is Supply and Demand? Economics Made Simple
The most powerful idea in economics — how prices, wages, and markets are shaped by two simple forces.
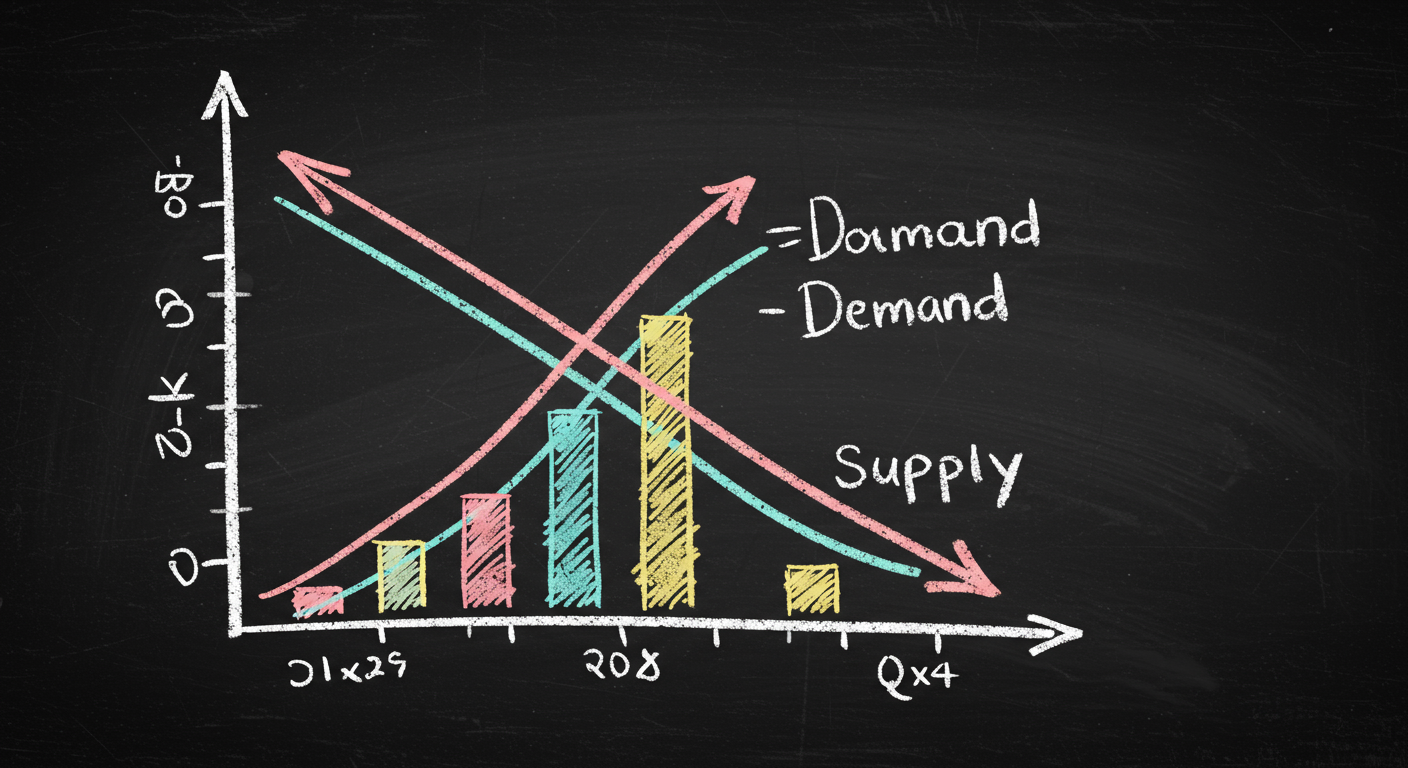
- Supply and demand curves and how equilibrium price forms
- Price elasticity: why gas prices spike but Netflix doesn't
- Minimum wage, rent control, and what happens when you override the market
- Real examples: housing, healthcare, concert tickets, surge pricing
1. The two forces behind every market
What Is Supply and Demand? Economics Made Simple
The most powerful idea in economics — how prices, wages, and markets are shaped by two simple forces.
Supply and demand basics
Demand is the quantity buyers want at each price.
Supply is the quantity sellers offer at each price.
Equilibrium price is the price where quantity demanded equals quantity supplied.
The core rule
- Lower price → more quantity demanded
- Lower price → less quantity supplied
- Higher price → less quantity demanded
- Higher price → more quantity supplied
Why this matters
Markets use prices to coordinate millions of choices. When price changes, both sides react.
A simple example
If a movie ticket costs $5, more people want to go. If it costs $50, fewer people buy. At the same time, the theater has a limited number of seats. That is supply. The market price has to work for both sides.
2. How equilibrium works in real markets
Shortage and surplus
When price is too low, quantity demanded is greater than quantity supplied. That is a shortage.
When price is too high, quantity supplied is greater than quantity demanded. That is a surplus.
Market adjustment
- Shortage puts upward pressure on price
- Surplus puts downward pressure on price
- The market tends to move toward equilibrium
{"type":"line","title":"Price and quantity in a market","data":[{"x":"$2","y":90},{"x":"$3","y":70},{"x":"$4","y":50},{"x":"$5","y":35},{"x":"$6","y":20}]}
Real-world shifts
Demand can rise because of population growth, higher incomes, or a trend.
Supply can fall because of bad weather, higher fuel costs, or factory shutdowns.
A curve shift changes the market price even if no one changes their mind about the product itself.
3. Elasticity: why some prices move fast and others barely move
Elastic vs. inelastic demand
Elastic demand: buyers change behavior a lot when price changes.
Inelastic demand: buyers change behavior only a little.
Examples
- Gasoline in the short run: usually inelastic
- Netflix: often more elastic than gas, because subscriptions are easy to cancel
- Insulin: very inelastic for many patients, because it is medically necessary
Why elasticity changes the burden
A tax on a product with few substitutes is harder to avoid. A tax on a product with many substitutes is easier to dodge. That is why economists care about elasticity before they judge a policy.
4. When policy overrides the market
Price ceilings and price floors
A price ceiling is a legal maximum price.
A price floor is a legal minimum price.
Common examples
- Rent control: price ceiling on housing rents
- Minimum wage: price floor on labor
- Ticket caps: ceiling on event prices
Main tradeoff
Lower prices can help some people now, but they can also create shortages later.
Minimum wage in plain language
If a worker’s productivity is worth less than the legal wage, firms may hire fewer workers. If productivity is higher, firms may absorb the higher wage more easily. That is why economists study local conditions instead of treating every market the same.
Rent control in plain language
Rent control can protect current tenants, but it can also reduce new construction and maintenance. The long-run housing shortage is the hidden cost many cities face.
5. Putting it all together in the world you live in
Real examples of supply and demand
Housing
More people, fewer homes, or slower construction pushes prices up.
Healthcare
Demand is often inelastic because treatment is necessary.
Concert tickets
Supply is fixed by venue seats, so prices can jump fast.
Surge pricing
Higher prices can pull in more drivers during busy times.
The three questions to ask
- How sensitive are buyers to price?
- How quickly can sellers increase supply?
- Is the market price free to move?
If you know those three things, you can explain most price changes.
Keep going with Slate
Pick up where this left off in your own voice session.